
The Kansas City District of the U.S. Army Corps of Engineers has asked local and state authorities and the public to pay close attention to conditions on the Missouri River, as the threat to levees is significant.
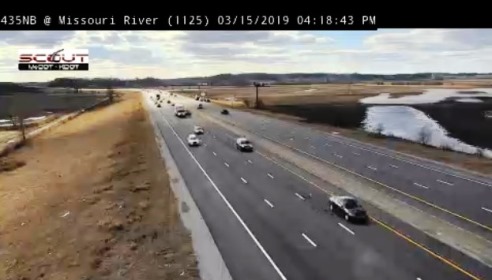
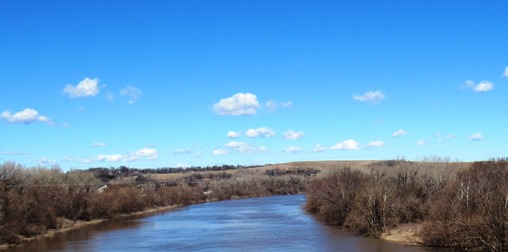
Flooding is ongoing on the Missouri River and its tributaries at some communities upstream from Kansas City. A quick glance at a few places in the Wyandotte County community today saw that rivers are high, but they did not appear to be flooding.
More water was released Thursday and today into the Missouri River from a reservoir in South Dakota, according to the corps.
Water releases upstream went from 50,000 cubic feet per second to 90,000 cubic feet per second on Thursday, March 14, at Gavins Point Dam in South Dakota, then earlier today releases went to 100,000 cubic feet per second. Today the corps stated it plans to make a reduction of 7,000 cubic feet at regular intervals of around 12 hours on Saturday, but that plan could change overnight, according to officials.
The corps cited heavy runoff from rain and melting snow, and heavy inflows into the dam at Gavins Point. It usually takes three to four days from the water from South Dakota to reach the Kansas City area, according to officials.
Communities upstream along the Missouri River already are experiencing flooding, including Leavenworth and Atchison, Kansas, St. Joseph, Missouri, and Parkville, Missouri.
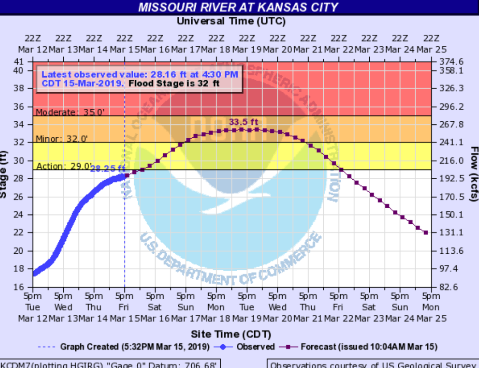
A hydrology chart from the National Weather Service showed the Missouri River at Kansas City was 28.16 feet at 4:30 p.m. Friday, March 15, with flood stage at 32 feet. It was projected to rise to action stage Saturday, and to minor flood stage on Sunday evening, cresting at 33.5 feet from March 17-18, then declining out of flood stage on March 20.
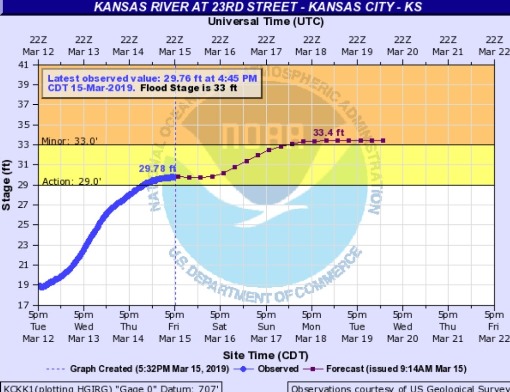
A hydrology chart also showed that the Kansas River at 23rd Street in Kansas City, Kansas, had risen into the action stage this morning. It is projected to go into minor flood stage on March 17 or 18, according to the chart.
A news release today from the Corps of Engineers stated that water releases were cut to a minimum at Tuttle Creek Dam in the Manhattan, Kansas, area because of flooding downstream.
A Corps of Engineers’ chart showed flows on the Missouri River at Kansas City at 96.7 cubic feet per second (figures are in the thousands) on March 12, rising to 107.7 cfs on March 13, to 173 cfs on March 14 and 209.9 cfs on March 15. It is projected to go up to 240.8 cfs on March 16, 270.6 cfs on March 17 and 291.4 cfs on March 18, before declining to 273.1 cfs on March 19. (See http://www.nwd-mr.usace.army.mil/rcc/reports/pdfs/GRFT.pdf).
The Corps of Engineers activated an Emergency Operations Center on Wednesday evening in the Kansas City area, and the area is under an Emergency Watch condition. It is at a partial activation level, according to a news release, designed to collect, evaluate, interpret and disseminate information on flooding. It is providing direct and technical assistance to levee owners and has dispatched teams to work with state emergency agencies, including providing sandbags and sandbag filling machines.


